
What is a PivotTable?
PivotTable is one of the most powerful features in Excel. It will save you a lot of time to summarize your large, detailed data set into a meaningful report.
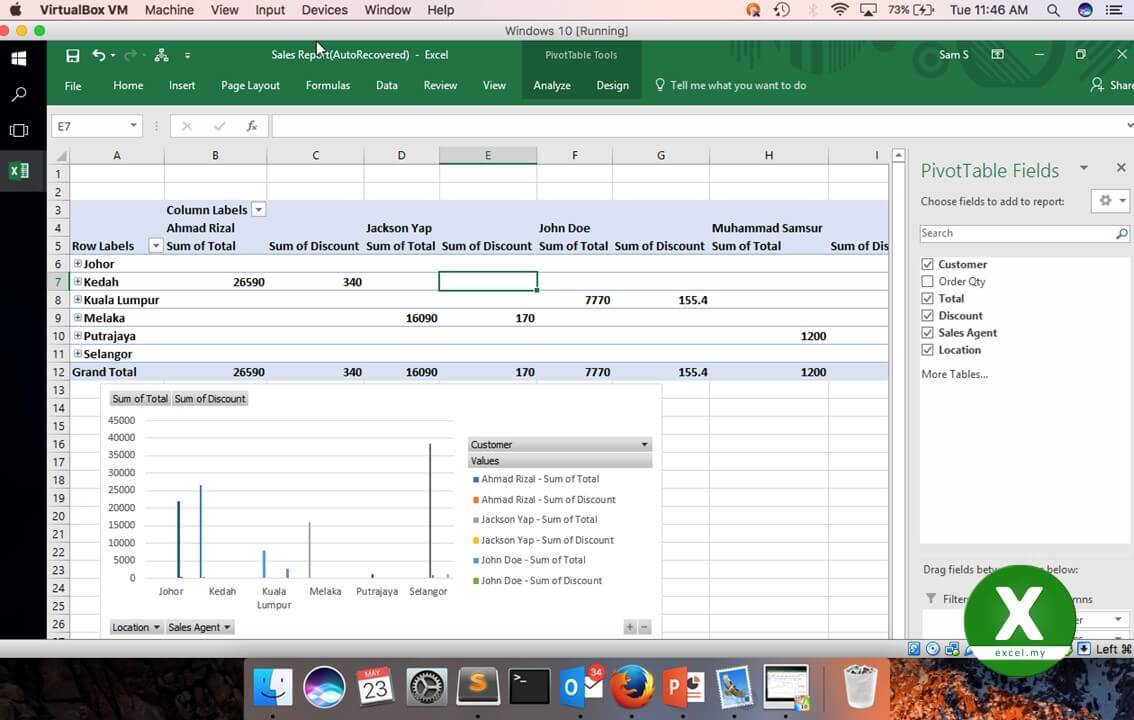
Let’s say you have a worksheet that contains monthly sales data and you want to know which customer from which area has the highest sales amount in this month. You could, of course, look through the worksheet and manually sort and calculate the data and create a new summarized table for it.
But how if your data contain thousands and thousands of rows? Using PivotTable can automatically aggregate all the data and calculate their respective sums in just a few clicks. You can always change how the figure display according to you needs.
You can also create a PivotChart based on your PivotTable and apply a filter to easily compare these numbers. The PivotChart will automatically update when your PivotTable do.
Want to have a better understanding of PivotTables or PivotCharts? Register our Microsoft Excel Advanced Training to learn more about Excel and its various powerful features.
Upcoming Microsoft Excel Advanced Training on 13-14 July 2017.
Contact us info@excel.my or 03-8011 6639.
Find out more http://www.excel.my/